Table of Contents
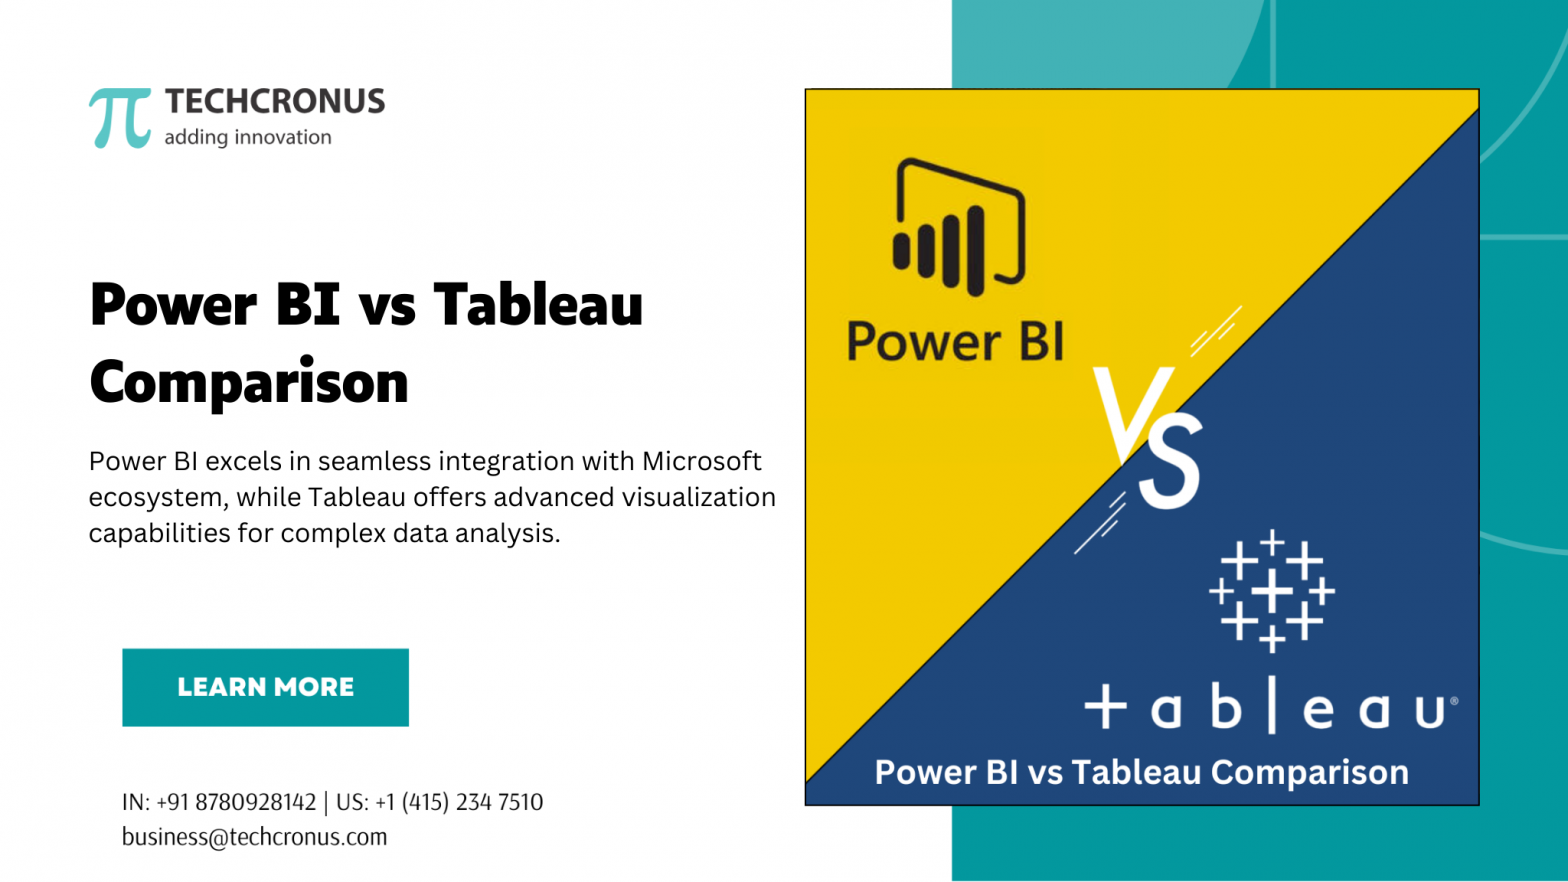
Power BI and Tableau stand at the forefront of business intelligence tools, offering unparalleled capabilities in data visualization and reporting. While Power BI is celebrated for its seamless integration with Microsoft’s suite and affordability, Tableau distinguishes itself with high-caliber, interactive dashboards, making the Power BI vs Tableau debate a topic of significant interest for businesses.
Artificial intelligence and business intelligence help companies comprehend and extract important data. Businesses will need this in the future if they want to keep up with the rapid pace of technological change and continue to expand despite intense competition.
This article aims to dissect the Power BI vs Tableau discussion, focusing on aspects such as ease of use, customization, data integration capabilities, and pricing models.
Overview of Power BI
Power BI, developed by Microsoft, is a robust platform that caters to both self-service and enterprise-level business intelligence (BI) needs. This unified platform is designed to:
Connect and Visualize Data: Users can easily connect to any data source, visualize critical insights, and integrate these visuals into daily applications, promoting data-driven decisions.
Unify BI: It bridges self-service BI and enterprise-scale analytics, fostering innovation and insights across all organizational levels.
Infuse Data Experiences: Power BI enhances decision-making by integrating insights into the apps users interact with daily.
Power BI’s accolades, such as its high ranking in the Gartner Magic Quadrant for Analytics and Business Intelligence Platforms and its top score in The Forrester Wave, underscore its effectiveness and vision in the BI space.
Advantages of Power BI
- Since it is a Microsoft product, Power BI works nicely with other Microsoft applications such as Excel, SharePoint, and SQL Server.
- The straightforward drag-and-drop functionality and user-friendly interface of Power BI make it easy to produce reports and dashboards without requiring substantial technical knowledge.
- Power BI’s rapid data processing allows customers to swiftly obtain insights, even when dealing with massive amounts of data.
- Power BI’s pricing options are designed to be economical for small enterprises. They provide both a free edition and a low-cost subscription plan.
Disadvantages of Power BI
- Although Power BI does offer a lot of customization choices, they may not be as flexible or customizable as Tableau’s.
- Power BI connects to fewer data sources than Tableau, which can be an issue if you need to work with data from several sources.
- Downsides of the free version of Power BI include a reduced data capacity and a lack of functionality compared to the commercial version.
Overview of Tableau
Tableau has carved a niche for itself in the data visualization arena with its powerful and intuitive features. Known for its ability to handle large volumes of data swiftly, Tableau facilitates the visualization of complex datasets without compromising performance.
It shines in its drag-and-drop interface, allowing users, regardless of their technical expertise, to create visually appealing and interactive dashboards and reports. This ease of use is complemented by Tableau’s vast array of visualization options, ranging from basic bar and line charts to more complex scatter plots and maps, ensuring that users can present their data in the most insightful manner. With the guidance of skilled Tableau Consultants, businesses can further enhance these dashboards to align with their specific analytical goals and gain deeper insights from their data.
Advantages of Tableau
- Tableau is noted for its powerful data visualization. It simplifies data analysis and interaction with its extensive visualization tools, including charts, graphs, and more.
- In terms of data sources, Tableau gives users a lot of leeway, letting them connect to all types of sources, even cloud-based databases.
- The reports and dashboards created using Tableau can be highly customized to meet the specific requirements of each user, both in terms of design and functionality.
- With Tableau’s huge and active user community, you can easily find help and learn from others by sharing tips, resources, and best practices.
Disadvantages of Tableau
- Premium features and numerous licenses can drive up the price of Tableau, which is a concern for smaller enterprises.
- Tableau has a steeper learning curve than Power BI, making it less user-friendly for users without a technical background or who are just starting out.
- Large data sets or complicated calculations may cause Tableau to have performance issues, which in turn slows down the analysis process.
Key Feature Comparison – Power BI vs Tableau
Tableau and Power BI are essentially different in terms of their user interface, data handling capabilities, and ability to integrate with other platforms and tools.
Both Power BI and Tableau are strong business intelligence tools that let you see and analyze data. There are a few similar features, but there are also significant differences:
User Interface: The user interface of Tableau is more pleasant and straightforward, featuring easier-to-use visuals and drag-and-drop capability. Although PowerBI offers more sophisticated features for expert users, learning how to utilize it may take a bit longer.
Performing Calculations: Power BI relies on the DAX language to compute data in columns, while Tableau uses the MDX language to perform similar calculations. Tableau also lacks Power Pivot, a capability that Power BI use to execute effective and efficient data analysis.
Data Integration: When it comes to data integration, Power BI is more strongly connected with Microsoft products like Excel and SQL Server, whereas Tableau has more flexibility to connect to various sources, such as cloud-based services and databases like Amazon Redshift, Cloudera Hadoop and Google Analytics.
Programming: Power BI is compatible with Data Analysis Expression and M language, which allow users to manipulate and model data. Accessible solely to enterprise-level users, it can also integrate with the R language using Microsoft Revolution Analytics.
Tableau has tighter integration with the R language than Power BI. Python, C, C++, and Java are the four languages that can be used to create the Tableau Software Development Kit. With these programming languages, you may create better visualizations.
Personalization: When compared to PowerBI, Tableau offers a wider range of options for personalizing dashboards and visualizations.
Collaboration: Power BI comes with a plethora of in-built collaboration features like co-authoring and commenting, while Tableau necessitates external tools to accomplish the same tasks. Power BI is more suited to individual user analysis, whereas Tableau offers more extensive collaboration tools, such as the ability to create and share interactive dashboards with multiple users.
Licensing: Microsoft licenses Power BI per user, while Salesforce owns Tableau and licenses it per user or per server.
Connectivity to External Data Sources: Tableau offers greater flexibility in connecting to external apps and data sources than PowerBI does, but PowerBI is strongly linked with other Microsoft products such as Excel, Azure, and Dynamics 365.
Visualization Capabilities: Tableau’s superior charting choices and renown for visualization make it stand out. PowerBI, on the other hand, features an interface that is more intuitive and user-friendly for the creation of essential charts and visualizations.
Data Modeling: When comparing PowerBI to Tableau, the former is clearly superior due to its superior data modelling and ETL (Extract, Transform, Load) features.
Mobile App: The iOS and Android versions of Power BI’s app are more feature-rich than those of Tableau.
Pricing and Licensing Models
When it comes to the pricing and licensing models of PowerBI and Tableau, businesses must consider their budgets and requirements. Tableau is designed to handle large data volumes and visualize unlimited data points, while PowerBI is a cost-effective solution for small to medium-sized businesses and beginners.
Power BI Pricing Tiers:
- Free Version: Suitable for individual users starting with data visualization.
- Power BI Pro: $9.99/user/month – Offers collaboration features and more data refresh rates.
- Power BI Premium Per User: $20/user/month – Additional AI capabilities, larger data volumes, and faster refresh rates.
- Power BI Premium: The monthly cost for this service is $4,995, and it offers dedicated cloud resources specifically designed for large enterprises.
Tableau Pricing Plans:
- Tableau Viewer: $12/user/month – For users who need to view and interact with dashboards.
- Tableau Explorer: $35/user/month – Offers more analytical capabilities for those diving deeper into data.
- Tableau Creator: $70/user/month – Full access to Tableau’s capabilities including data prep and advanced analytics.
Notably, PowerBI integrates seamlessly with other Microsoft products like Azure and Office 365, enhancing its value proposition for users already in the Microsoft ecosystem. On the other hand, Tableau provides a comprehensive 360-degree view of data with its advanced analytics, making it suitable for data-intensive environments.
Conclusion
The decision between Power BI and Tableau rests on careful consideration of factors such as budget, the complexity of data analysis needs, and existing technological infrastructure. While Power BI consulting firms often highlight their accessibility and affordability, Tableau represents a robust solution for those seeking extensive customization and analytical depth. Regardless of the choice, both platforms drive meaningful insights and enhance data-driven decision-making, underscoring their invaluable role in today’s increasingly data-centric business landscape.
If you are new to business intelligence and are looking for a way to visualize data more effectively, Microsoft Power BI is a great choice. And Tableau is a great option if you know your way around coding and have familiarity with business intelligence tools.
PowerBI is the clear winner when it comes to ease of use, but Tableau is a good place to start if you need to make a lot of changes using code.